Wednesday 25 May 2016

Advanced Metrics Visualization Dashboarding With Apache Ambari


by Sarang Nagmote


Category - Data Analysis
More Information & Updates Available at: http://vibranttechnologies.co.in


At Hortonworks, we work with hundreds of enterprises to ensure they get the most out of Apache Hadoop and the Hortonworks Data Platform. A critical part of making that possible is ensuring operators can quickly identify the root cause if something goes wrong.
A few weeks ago, we presented our vision for Streamlining Apache Hadoop Operations, and today we are pleased to announce the availability of Apache Ambari 2.2.2 which delivers on the first phase of this journey. With this latest update to Ambari, we can now put the most critical operational metrics in the hands of operators allowing them to:
  • Gain a better understanding of cluster health and performance metrics through advanced visualizations and pre-built dashboards.
  • Isolate critical metrics for core cluster services such as HDFS, YARN, and HBase.
  • Reduce time to troubleshoot problems, and improve the level of service for cluster tenants.

Advanced Metrics Visualization and Dashboarding

Apache Hadoop components produce a lot of metric data, and the Ambari Metrics System (introduced about a year ago as part of Ambari 2.0) provides a scalable low-latency storage system for capturing those metrics.  Understanding which metrics to look at and why takes experience and knowledge.  To help simplify this process, and be more prescriptive in choosing the right metrics to review when problems arise, Grafana (a leading graph and dashboard builder for visualizing time-series metrics) is now included with Ambari Metrics. The integration of Grafana with Ambari brings the most important metrics front-and-center. As we continue to streamline the operational experiences of HDP, operational metrics play a key role, and Grafana provides a unique value to our operators.

How It Works

Grafana is deployed, managed and pre-configured to work with the Ambari Metrics service. We are including a curated set dashboards for core HDP components, giving operators at-a-glance views of the same metrics Hortonworks Support & Engineering review when helping customers troubleshoot complex issues.
Metrics displayed on each dashboard can be filtered by time, component, and contextual information (YARN queues for example) to provide greater flexibility, granularity and context.
Ambari_Grafana

Download Ambari and Get Started

We look forward to your feedback on this phase of our journey and encourage you to visit the Hortonworks Documentation site for information on how to download and get started with Ambari. Stay tuned for updates as we continue on the journey to streamline Apache Hadoop operations.

Fixing MySQL Scalability Problems With ProxySQL or Thread Pool


by Sarang Nagmote


Category - Databases
More Information & Updates Available at: http://vibranttechnologies.co.in


In this blog post, we’ll discuss fixing MySQL scalability problems using either ProxySQL or thread pool.
In the previous post, I showed that even MySQL 5.7 in read-write workloads is not able to maintain throughput. Oracle’s recommendation to play black magic with innodb_thread_concurrency and innodb_spin_wait_delay doesn’t always help. We need a different solution to deal with this scaling problem.
All the conditions are the same as in my previous run, but I will use:
  • ProxySQL limited to 200 connections to MySQL. ProxySQL has a capability to multiplex incoming connections; with this setting, even with 1000 connections to the proxy, it will maintain only 200 connections to MySQL.
  • Percona Server with enabled thread pool, and a thread pool size of 64
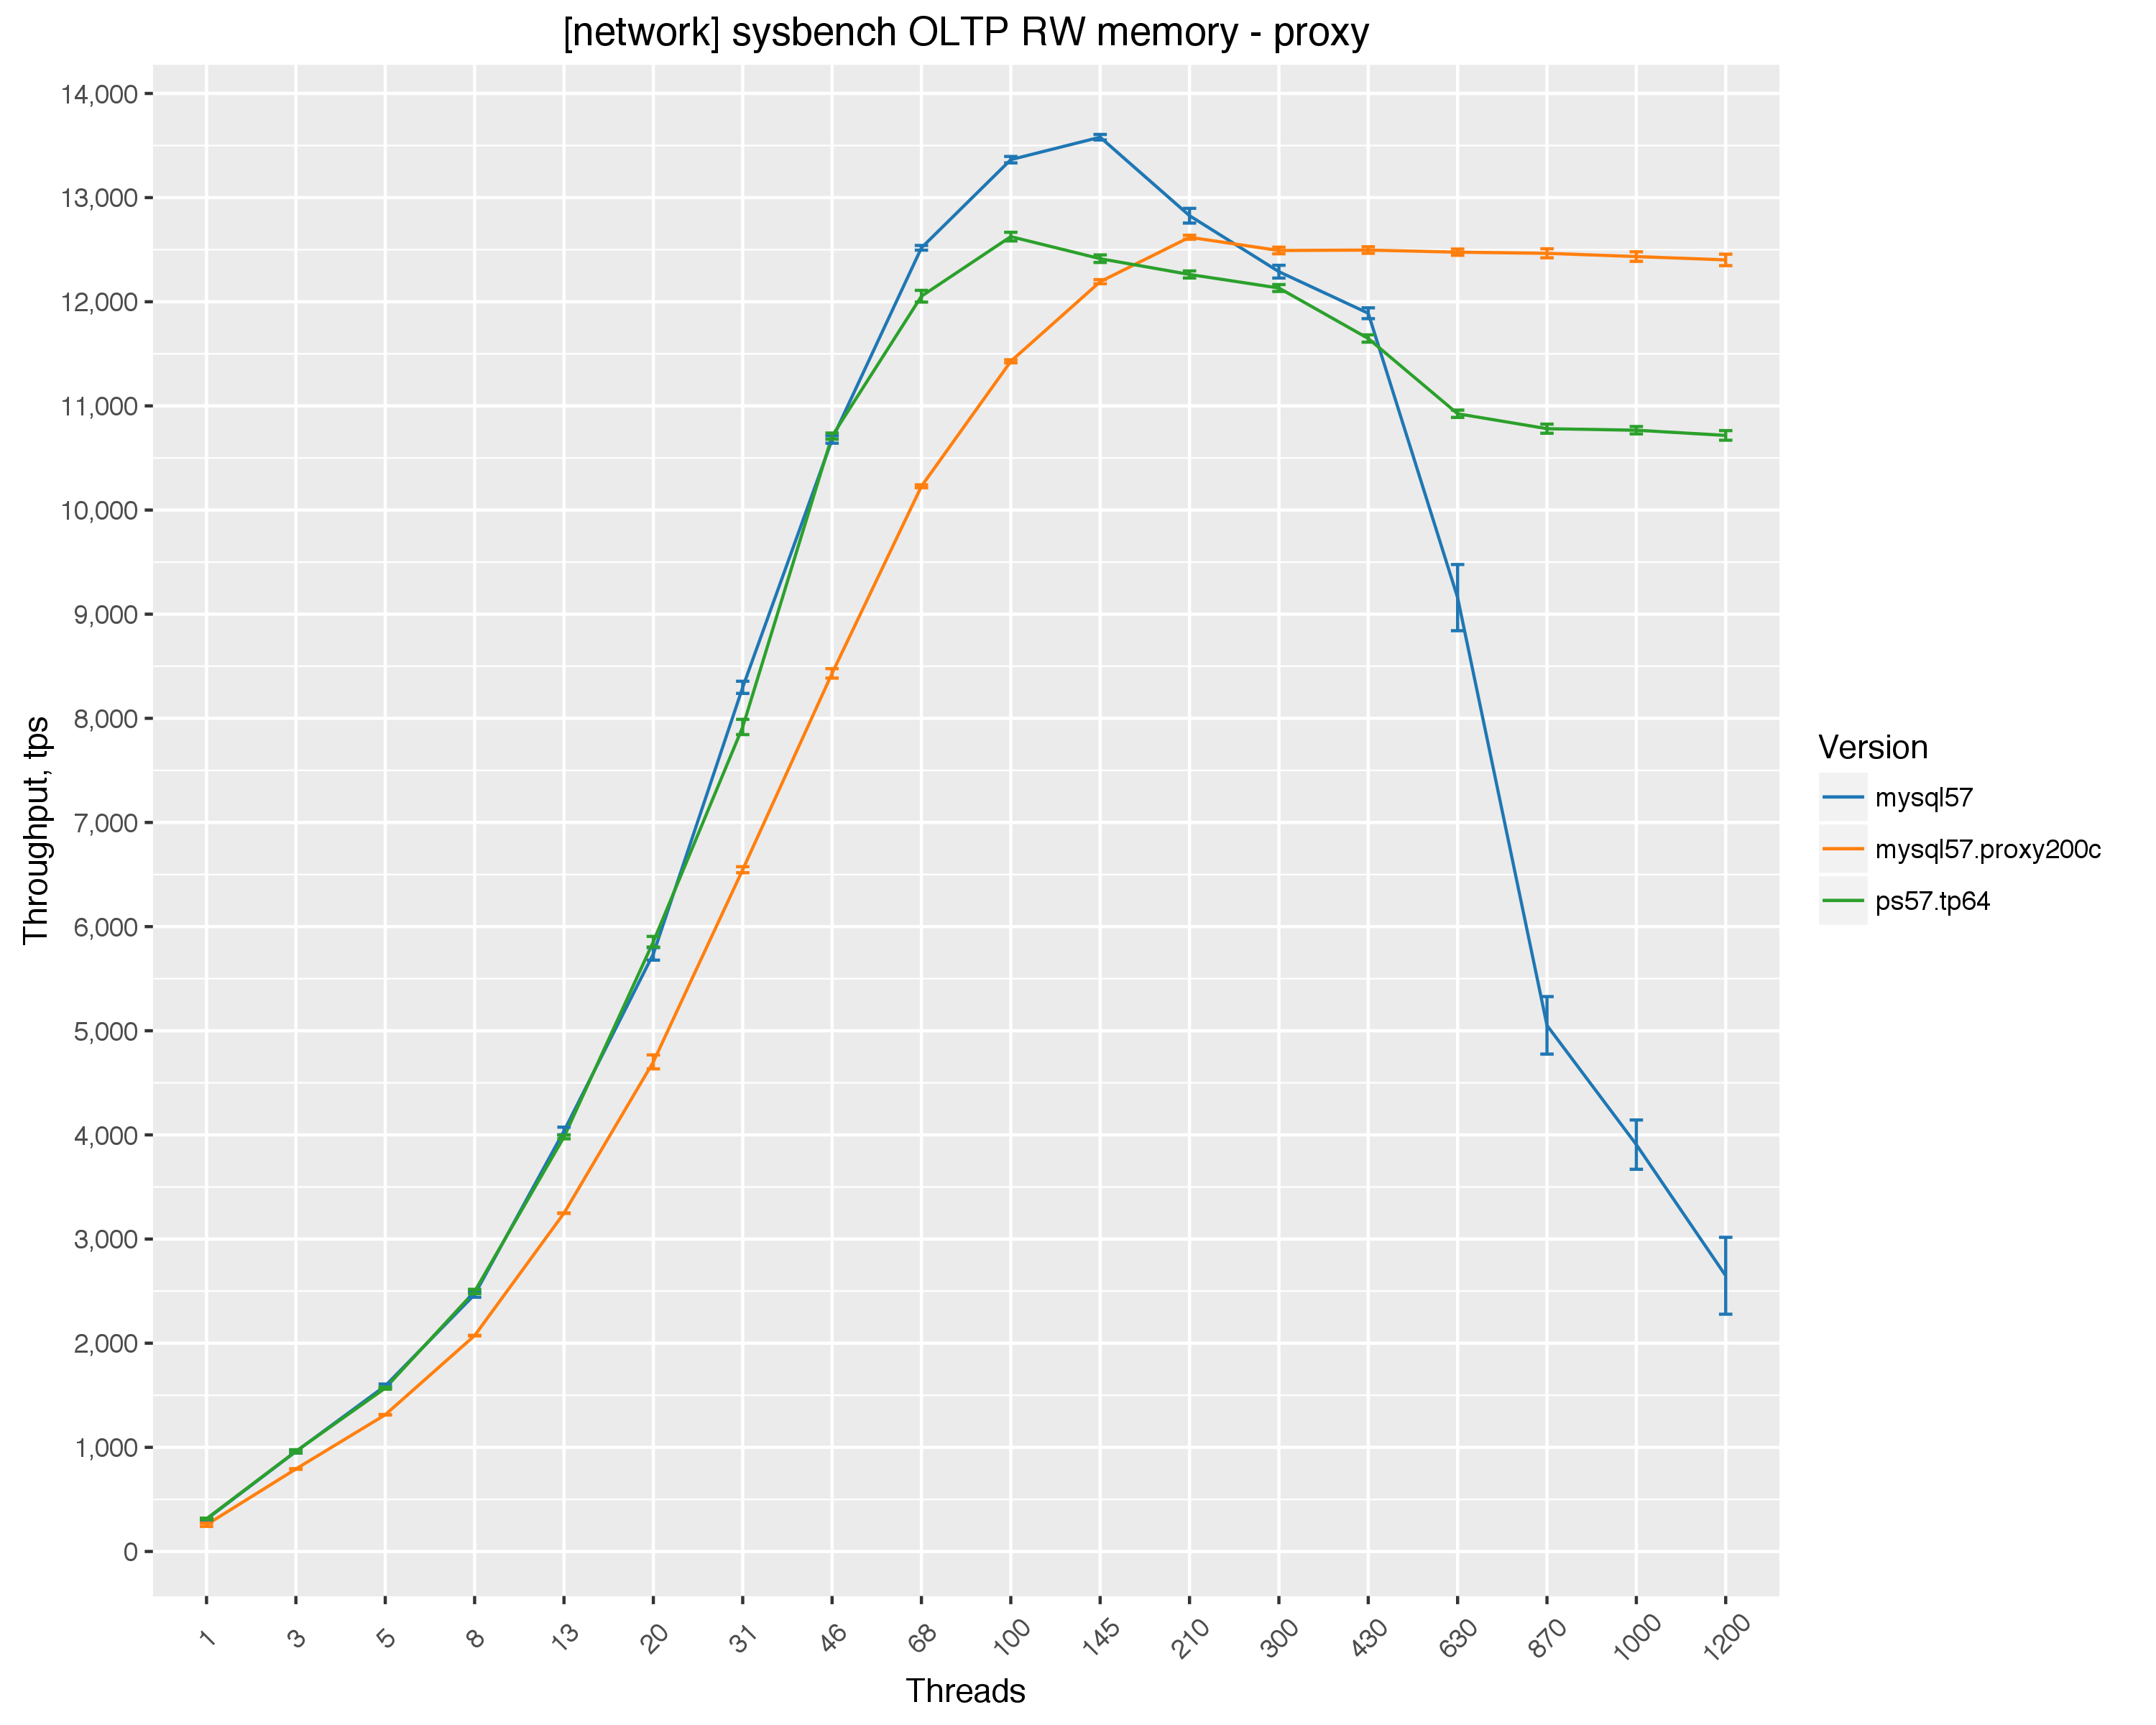
You can see final results here:
Fixing MySQL scalability problems
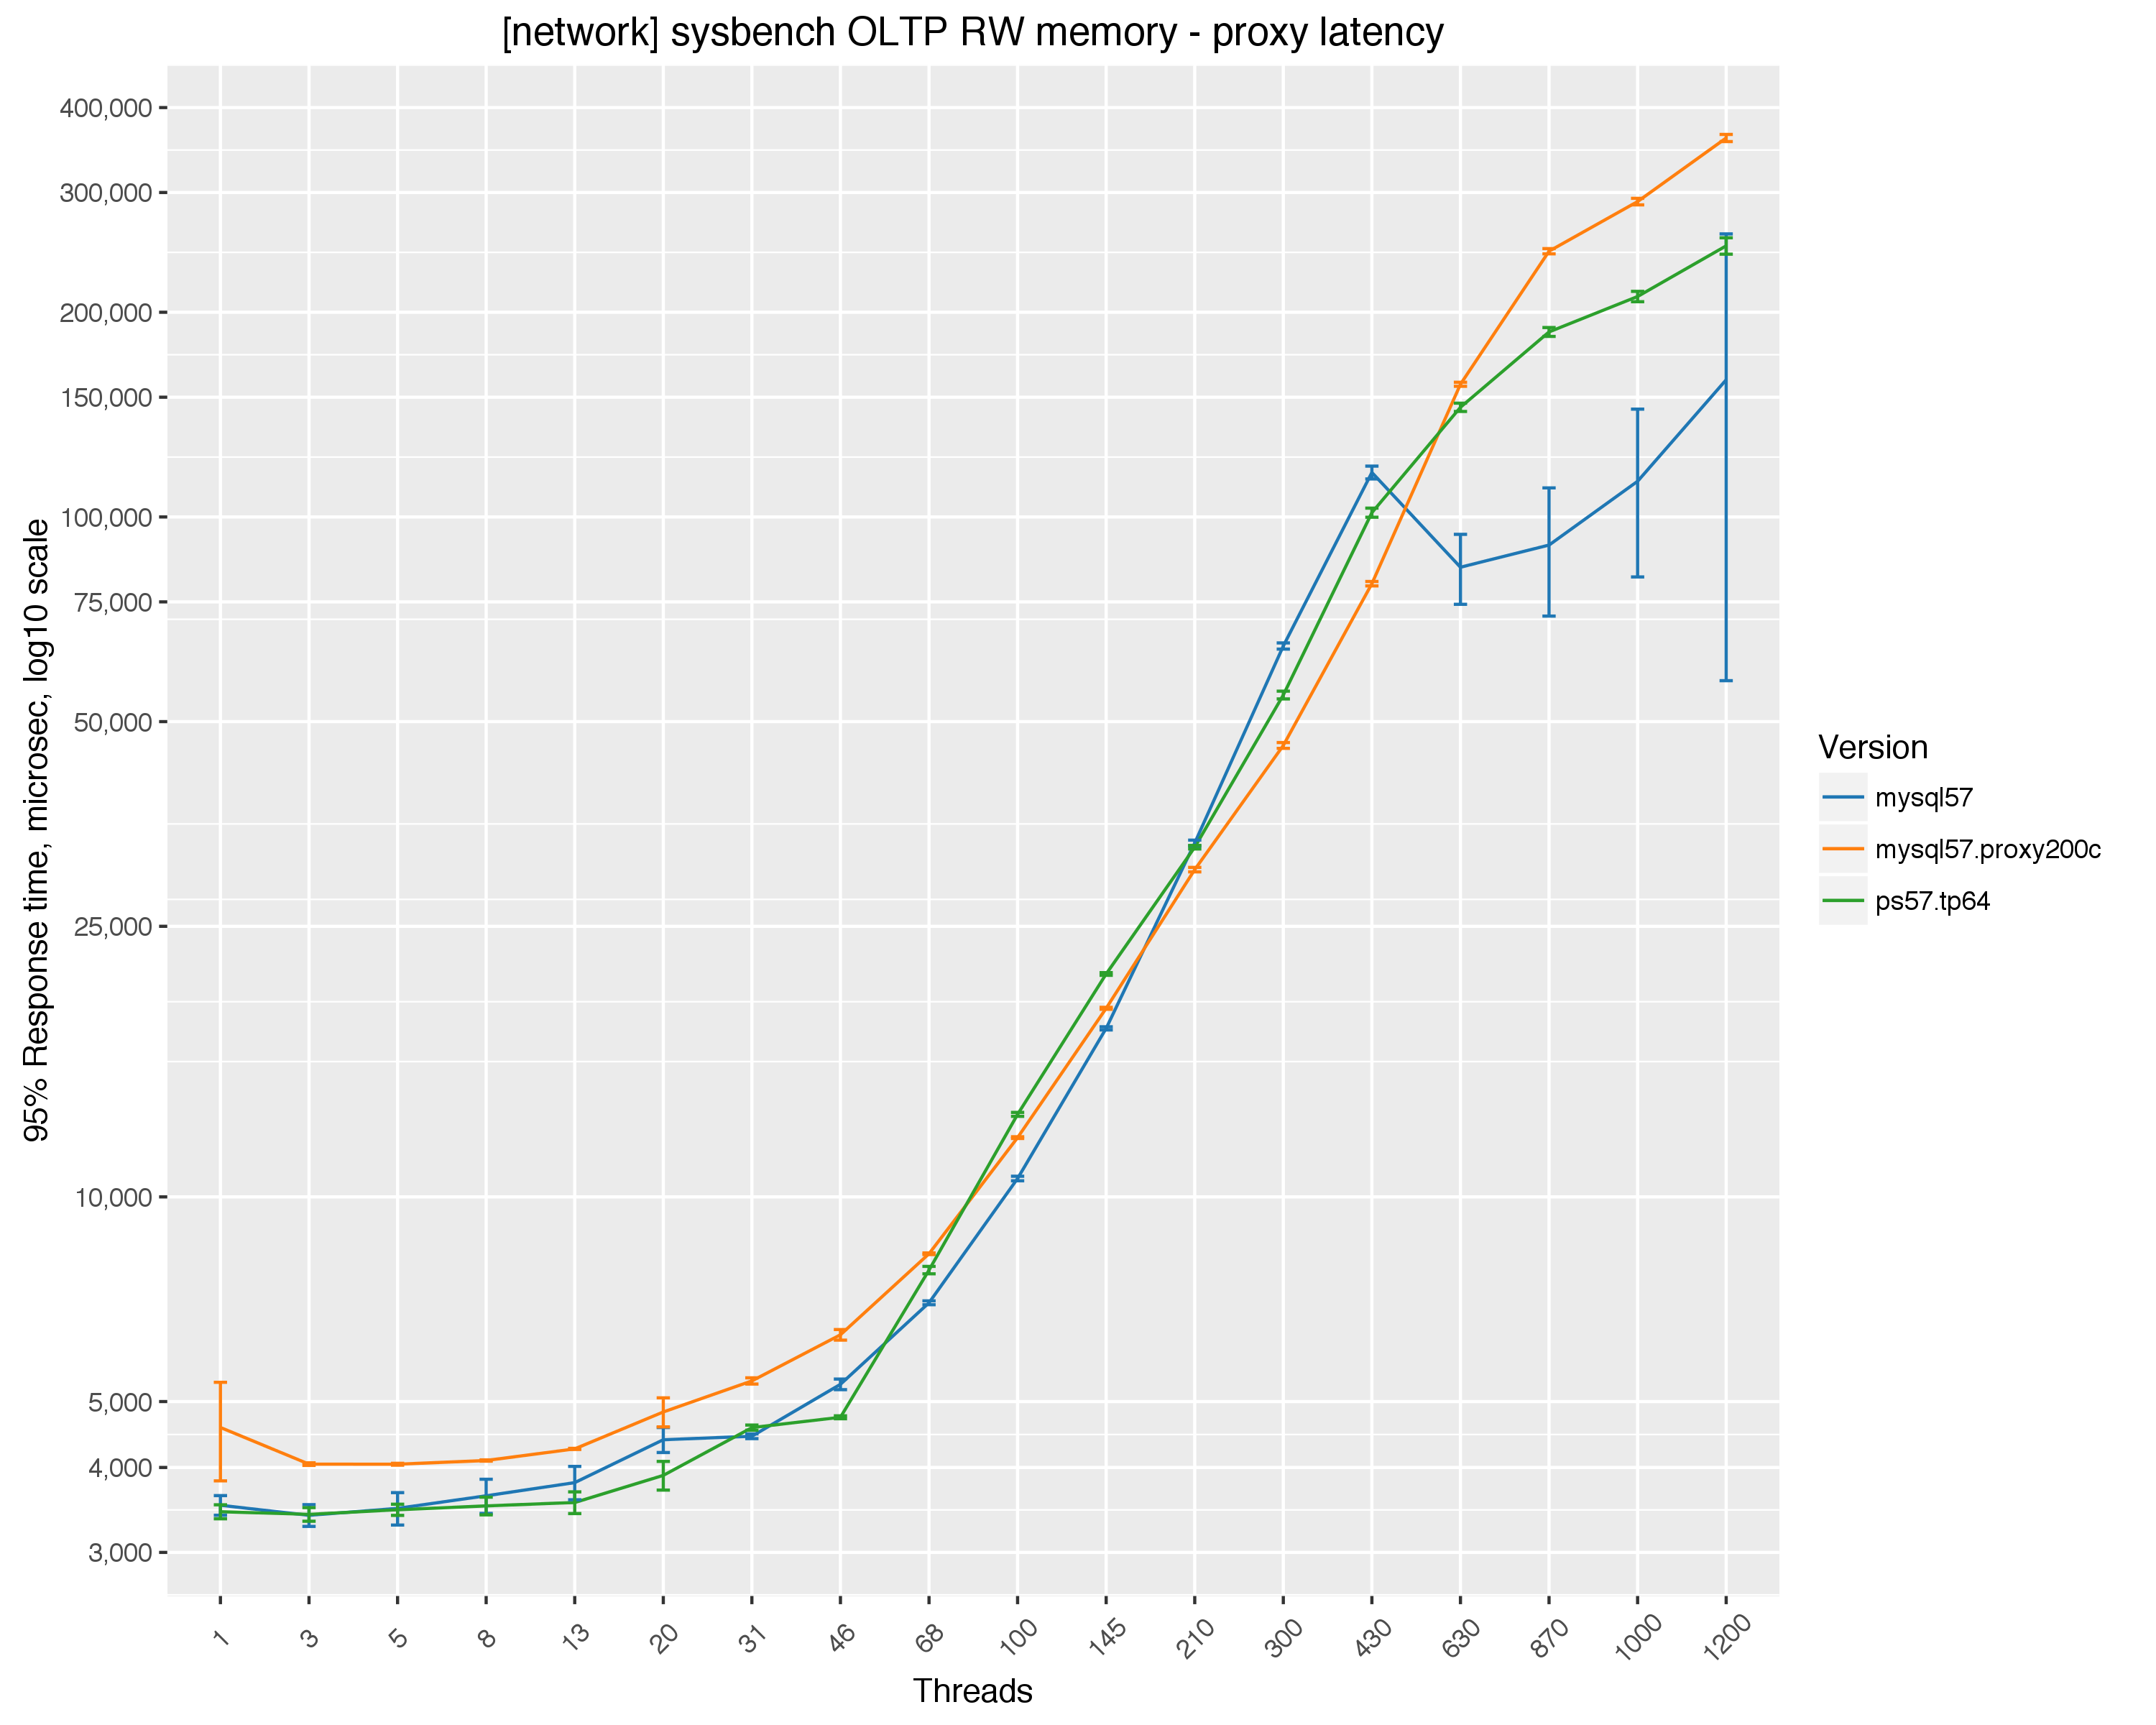
There are good and bad sides for both solutions. With ProxySQL, there is a visible overhead on lower numbers of threads, but it keeps very stable throughput after 200 threads.
With Percona Server thread pool, there is little-to-no overhead if the number of threads is less than thread pool size, but after 200 threads it falls behind ProxySQL.
Here is the chart with response times:
I would say the correct solution depends on your setup:
  • If you already use or plan to use ProxySQL, you may use it to prevent MySQL from saturation
  • If you use Percona Server, you might consider trying to adjust the thread pool

Summary

Coupling in Distributed Systems


by Sarang Nagmote


Category - Cloud Computing
More Information & Updates Available at: http://vibranttechnologies.co.in


Coupling and cohesion are key quality indicators. We strive for highly cohesive and loosely coupled systems, but high doesnt mean pure. The same goes with functional programming, we aim for isolating and reducing side effects, but we need them unless we want a useless system. Its good to modularise our systems, so whenever those modules need to talk to each other theyll effectively couple themselves. Our work is to create cohesive modules and minimize coupling as much as possible.
Lets provide an example. Our system has the following structure:
  1. Different deployables, aka, microservices architecture.
  2. Intracommunication through Kafka (pub-sub messaging). No HTTP involved.
  3. 1 Producer to N Consumers scenarios.
  4. JSON for data serialization.
The messages that are published and consumed in this system have a schema and its our choice making it implicit or explicit and validating that schema at compile or runtime execution. Before analysing the trade-offs of every approach lets say some words about compile vs runtime approaches.

Proofing Software Correctness as Soon as Possible

Ive been a user of statically typed languages most of my career, so Im really biased with this topic. I strongly believe in Lean concepts as the importance of minimizing waste. At the same time, I love the therapeutic ideas behind Agile, TDD, or BDD about exposing the truth as soon as possible. Static types, and in the end the compiler, help me to achieve those goals.
I would prefer spending my time creating tests under the motivations of providing living documentation, easing future refactors, or helping me to drive the design, more than helping to catch bugs that the type system should take care of. Writing a test that checks the behaviour of a method when receiving null is a waste of time if we can make it impossible to write a line of code that passes a null.
The compile world is not perfect though, as its definitively slower on development and constrains developers (someone could say that less freedom might be a nice-to-have in this context).

Runtime Approaches

Now that Ive been honest with you about my compile bias, I can explain different approaches and trade-offs for the schema validation problem.

Implicit Schemas

The first runtime approach is the loosest one: using implicit schemas and trusting in the good will of producers. As nobody is checking the validity of messages before being published into Kafka that means that consumers could blow up.
The first corrective measure is assuring that only the processing of the poisoned message will blow and not the whole consumer. An example of that would be providing a resume supervision strategy on Akka Streams when the message doesnt hold the expected implicit schema.
The second corrective measure would be not simply swallowing those crashes but being able to communicate them to proper actors (being humans or software). A good practice is to provide dead letter queues for poisoned messages just in case we want to manipulate and retry the processing of those messages at that level.
Before getting into explicit schemas, I would say that those measures are usually not enough but they are a good safety net, as shit happens, and we need to be prepared.

Explicit Schemas

If we want to avoid poisoned messages getting into our topics we could provide a middle-man service to intercept and validate explicit schemas. Schema registry is an example of that for Kafka, and its documentation is full of insights about how to implement that in a distributed, highly available, and scalable way.
Thats an integration service that could be a single point of failure but, at the same time, it could be valuable to have a centralized repo of schemas when we have a lot of consumers and the complexity of the system would be hard to grasp in a decentralized fashion. That service will be stateless, so in order to avoid single point of failures, we could make it redundant in a farm of services to allow high availability.

Compile Approaches

The last approach would be creating software that makes it impossible to create messages that do not hold the expected schema. Assuming Scala, we could create a jar that contains case classes that are object materializations of a schema.
What are the benefits of this approach?
  1. Fail early. We dont have to wait until testing or production to verify that the messages published by some producer are correct.
  2. Centralized knowledge.
What is the solvable problem?
  • Cascade updates. If our microservices live in different repos, then we need to make sure that updates into that common binary are applied into producer and consumers. Thats cumbersome and if its not done could generate unexpected bugs as we introduced a false sense of security with that library. That could be solved using a monorepo.
What is the biggest problem?
  • Breaking isolation of deployables. One of the points of microservices is being able to deploy its services independently. If youre forced to redeploy N consumer services every time you upgrade the consumer with a non-backward compatible change of the schema library then youre losing that perk. Being able to do small releases is a big enabler of Continuous Delivery, so its a remarkable loss.
You could argue that only non-backward compatible changes force a redeploy of consumers and that we should design our schemas in a way that predicts and minimizes those kinds of changes.

Generalizing Coupling Problem

If we generalize the problem, well see that there are two kinds of coupling: avoidable and mandatory.
Avoidable coupling comes when we strive for reducing duplication in our codebase. Lets say that we want to extract some requestId from the header of a HTTP request and put it into some MDC in order to be able to trace logs across different threads or services. That code will hardly vary from service to service so its a good candidate to be extracted and therefore adding some coupling between services. Before doing that, its good to think about the following:
  1. Coupling is the enemy of microservices and its effects in the future are not easily visible.
  2. Following Conways law, breaking isolation of your services breaks the isolation of your teams, so be sure that your organization is able to cope with that level of communication and integration.
  3. The key measure is the rate change. A library that is going to be constantly updated (as could be your schema library) will be more painful to manage as a common dependency than some fairly static library.
Mandatory coupling comes when some info needs to reside in a third entity as it doesnt make sense to be held by one of the integration entities or its not worthy to share and duplicate that info into every single entity.

Conclusion

Even if I am a strong supporter of compiled languages, I think that sharing code through binaries in a distributed environment deserves a deep analysis of the structure and needs of your system. I hope that this post has provided some valuable insights into this topic.

Running a Multi-Container Application Using Docker Compose


by Sarang Nagmote


Category - Enterprise Integration
More Information & Updates Available at: http://vibranttechnologies.co.in


Running an application typically involves multiple processes whether that’s just an application server and database or multiple service implementations in a microservice architecture. Docker Compose provides a quick and easy mechanism to build, deploy, and run your application, whether locally on your system for development purposes or on a platform such as Docker Datacenter for production.
For the purposes of this example we have taken Docker’s example voting application and modified it so that the voting and results web applications are Java applications running on WebSphere Liberty. You can clone the updated application from GitHub and, assuming that you have Docker and Docker Compose installed, run it using the following simple commands:
git clone https://github.com/kavisuresh/example-voting-app.gitcd example-voting-appdocker-compose up
The following video gives an introduction to the example voting application and how it can be run using Docker Compose:

The following video talks about Docker Datacenter configuration and how the application can be run in Docker Datacenter using Docker Compose:

Unconventional Logging: Game Development and Uncovering User Behaviour


by Sarang Nagmote


Category - Website Development
More Information & Updates Available at: http://vibranttechnologies.co.in


Not long ago, I was given the chance to speak with Loggly’s Sven Dummer about the importance of logging for game development. However, I got more a lot more than just that… Sven actually gave me a comprehensive tour of Loggly via screenshare, telling me a bit about the basics of logging—its purpose and how it’s done—and what particular tools Loggly offers up to make it easier for those trying to sort through and make sense of the endless haystack of data that logs serve up. And after my crash course in logging and Loggly, Sven did indeed deliver a special use-case for logging that was particular to game development, though I think it can be applied creatively elsewhere, as well.
First off, let me recap a bit of information that Sven provided about logging and log management. If you want to skip ahead to the game dev use-case, feel free.

Crash Course: My Experience With Logging and Loggly

Upon sharing his screen with me, Sven first took me to the command line of his Mac to illustrate just how much information logging generates. He entered a command revealing a list of all the processes currently happening on his laptop and, as you’ve probably already guessed, there was a lot of information to show. Data spat out onto the page in chunks, and I quickly became overwhelmed by the velocity and disorganization of words and numbers perpetually scrolling onto the screen. This information—some of it obviously very useful to those that know what they’re looking for—was delivered piece by piece very quickly. The format of the data was “pretty cryptic to people like you and me” as Sven put it, but what we were looking at was comparatively easy compared to the data formats of some logs.
And that’s just it, there is no standard format for log data. It can come in a variety of file types and is displayed differently depending on the type. In Sven’s words:
“Every application or component typically writes its own log data in its own log file, and there is no one standardized format, so these log files can look very different. So, if you want to make sense of the data, you have to be somewhat familiar with the formats.”
And continuing on to explain how this can become even more difficult to manage when pulling data from a multitude of sources, Sven gave this example:
“Let’s imagine you’re running a large complex web application… you’re in a business that’s running a webstore. In that case, you might have a very complicated setup with a couple of databases, a web server, a Java application doing some of your business logic—so you have multiple servers with multiple components, which all do something that basically makes up your application. And so, if something goes wrong, then the best way to trace things down is in the log data. But you have all these different components generating different log files in different formats. And, if your application is somewhat complex and you have 25 different servers, they all write the log data locally to the hard drive so you can imagine that troubleshooting that can become quite difficult.”
He continued on to explain how a log management tool like Loggly can gather together these many different logs (it supports parsing of many different formats out of the box) and display them in a unified format—not only to make the information more presentable, but also to securely provide access to an entire team:
“Let’s say you have an operations team and these folks are tasked with making sure that your system is up and running. If they were supposed to look at the log data on all these individual servers and on all these components, they would have to know how to: 1. log into those servers, 2. be able to reach the servers inside your network, 3. have credentials there, 4. know where the log files reside; and then, they would still be looking at all of these individual log files without getting the big picture.
However, instead, they could send all of their logs to Loggly, locating them in one place. This not only allows for a cohesive picture of all the logs that make up a web application [for example], but it also removes the need for everyone on your operations team to log into every single server in order to get access to the logs, which is important from a security perspective. Because, you don’t necessarily want everybody to be able to have administrative privileges to all these different servers.”
At this point, Sven launched Loggly and it was a complete sea-change. Rather than a black terminal window overflowing with indistinguishable blobs of text, the interface proved to be much more organized and user-friendly. With Loggly, Sven showed me how to search for particular logs, filter out unwanted messages, drill down to a specific event and grab surrounding logs, and display information in one standardized flow, so that it was much easier for the viewer to sort, scan, and find what he/she is after. He also pointed out how one might automate the system to track and deliver specific error messages (or other information) to corresponding team members who that information is best suited for. Through Loggly’s available integrations, one might have this information delivered via a specific medium, like Slack or Hipchat, so that team members receive these notifications in real time and can act in the moment. Honestly, there were so many features available that Sven showed to me, I don’t think I can cover them all in this post—if you want to see more about the features, take a look around this page for a while and explore the tutorial section.
Image title
Loggly integrated with Hipchat.

One thing I remember saying to Sven is that the command line view of logs looks a bit like the familiar green-tinged code lines that spastically scatter across the monitors in The Matrix, endlessly ticking out information on and on and on… and on. He was quick to point out that Loggly still provided a command line-esque views of logs via their Live Tail feature, but with more control. I highly recommend checking it out.
Image title
What logs look like to the untrained eye.
Image title
Loggly Live Tail in action... running in an OS X Terminal and on Windows PowerShell.

The Importance of Logging for Game Development

So, typically one might use logging to discover performance bottlenecks, disruptions in a system, or various other disturbances which can be improved after some careful detective work. However, when looked at through another lens, logs can offer up much more interesting information, revealing user behavior patterns that can be analyzed to improve a game’s design and creative direction. Let me take you through a couple of examples that Sven offered up which shed light on how one might use logs to uncover interesting conclusions.
Sven launched a Star Fox-esque flying game in his browser (a game written in Unity, a format which Loggly supports out of the box) and began guiding his spaceship through rings that were floating in the air. It was pretty basic, the point being to make it through each ring without crashing into the edges.
Image title
This is an image of Logglys demo game... not Star Fox!

While flying, he opened up Live Tail and showed me the logs coming in at near real-time (he explained there was a very small network delay). Back in the game, he began switching camera angles, and I could see a corresponding log event every time he triggered the command. This is where it gets interesting…
“The camera changes are being recorded in the log and I can see them here. Now, this is interesting because it will also tell me from which IP address they’re coming. And this is just a very simple demo game, but I could also log the ID of the user for example and many more things to create a user behaviour profile. And, that is very interesting because it helps me to improve my game based on what users do.
For example, let’s say I find out that users always change the camera angle right before they fly through ring five, and perhaps a lot of users fail when they fly through this ring. And, maybe that’s a source of customer frustration… maybe they bounce the site when they reach that point. And maybe then, I realize that people are changing the camera because there’s a cloud in the way that blocks the view of ring five. Then I can tell my design team you know, maybe we should take the cloud out at this point. Or, we can tell the creative team to redesign the cloud and make it transparent. So, now we’re getting into a completely different area other than just IT operations here. When you can track user behavior you can use it to improve things like visuals and design in the game.”
Image title
Logs gathered from the change in camera angles within the demo game.

I found this idea fascinating, and Sven continued on describing a conversation he had with unnamed Mobile game publisher who recently used Loggly in a similar way…
“We showed this demo at GDC and there was actually somebody who visited our booth who I had a very interesting conversation with on this topic. Basically, they told me that they develop mobile games for smart phones and had plans to introduce a new character in one of their games for gamers to interact with. Their creative team had come up with 6 or 7 different visuals for characters, so their idea was to do simple A/B testing and find out which of these characters resonated best with their users through gathering and studying their logs in Loggly. Then they planned on scrapping the character models that didn’t do well.
However, when they did their AB testing they got a result that they were not at all prepared for. There was no distinctive winner, but the regional differences were huge. So, people in Europe vs. Asia vs. America—there was no one winner, but rather there were clear winners by region. So, that was something that they were not expecting nor prepared for. And they told me that they actually reprioritized their road map and the work that they had planned for their development team and decided to redesign the architecture of their game so that it would support serving different players different characters based on the region that they were in. They realized, they could be significantly more successful and have a bigger gaming audience if they designed it this way.”
Once again, I found this extremely interesting. The idea of using logs creatively to uncover user behavior was something completely novel to me. But apparently, user behavior is not the only type of behavior that can be uncovered.
“Just recently there was an article on Search Engine Land where an SEO expert explained how to answer some major questions about search engine optimization by using Loggly and log data. Again, a completely different area where someone is analyzing not user behavior but, in this case, search engine robots—when do they come to the website, are they blocked by something, do I see activity on webpages where I don’t want these search robots to be active? So, I think you get the idea, really these logs can be gathered and used for any sort of analysis.”
And, that’s basically the idea. By pulling in such vast amounts of data, each offering its own clues as to what is going on in an application, log management tools like Loggly act as kind of magnifying glass for uncovering meaningful conclusions. And what does meaningful mean? Well, it’s not limited to performance bottlenecks and operational business concerns, but can actually provide genuine insights into user behavior or creative decision-making based on analytics.